3: Spatially Enabled Relational Databases
3.4 PostGIS CartoDB
You’ve been hired as a GIS consultant for the nonprofit Friends of Northampton Trails and Greenways. They want to improve drainage on their bike trails by installing some infrastructure on the sides of their trails (gravel, drainage ditches, etc). The bike trails they maintain go through some sensitive habitat however, and they need to get an estimate for how much sensitive habitat could be affected by this project. They’ve asked you to find the answer to this question: What is the total area of conserved lands within 100m of their bike paths in Easthampton, Northampton, Hadley, and Amherst?
You are probably accustomed to answering a question like this using ArcGIS or QGIS. This exercise shows how we can use PostGIS and a web mapping platform called CartoDB to perform spatial analyses similar to what we do in desktop GIS programs. CartoDB allows users to store spatial data (and other types of data) in the cloud on their servers. With their stored data, users can perform similar types of analysis to what we’ve been doing using PostgreSQL and PostGIS - in fact, CartoDB is built using PostgreSQL and PostGIS, so if you’re using CartoDB you’re actually using the same software we’ve been using even if it feels different. CartoDB provides a range of ways to build web maps. Casual users can rely completely on the graphical interface, the CartoDB Editor, without having to write a single line of code. More advanced users (that’s you!) can use a combination of the JavaScript library, the map-styling language CartoCSS, and SQL/PostGIS for maps with more advanced design and analytical features. If you want to continue making web maps after this course, CartoDB is a great way to do so without having to set up your own web server.
In this exercise, you’ll start with three layers from MassGIS…
- “Town Boundaries” – all towns in Massachusetts
- “Bicycle Trials” – all bike trails in Massachusetts
…and one layer that we provide you:
- “openspace_5coll” – conserved land in the Five College area
From these layers, you will generate…
- …a layer representing our study area (Easthampton, Northampton, Hadley, and Amherst)
- …a layer of bike trails that fall within the study area
- …a 100m buffer around these bike trails
- …a layer representing conserved areas that overlap this buffer.
Finally, you’ll calculate the total area of the last layer.
In this exercise, you’ll use three PostGIS tools – ST_Buffer(), ST_Intersects(), and ST_Intersection(). Look up these tools in the PostGIS documentation (http://postgis.net/documentation/) and try to answer the following questions:
- what are the inputs that each tool takes? In other words, what arguments does each tool take?
- what is the output of each tool?
When you’ve answered those questions, try to match each tool with the step that you’ll use it in. Note that one step does not require any PostGIS tool – you can do it with regular old SQL!
| Step | Which Tool? |
|---|---|
| Select 4 towns in Massachusetts (Easthampton, Northampton, Hadley, Amherst) | _ |
| Select bike trails inside these 4 towns | _ |
| Create buffer around these trails | _ |
| Create layer of overlap between buffers and conserved lands | _ |
Options:
ST_Intersects()
ST_Intersection()
ST_Buffer()
No PostGIS tool required
Upload data to CartoDB
Create a free account on CartoDB.com. Use your *.edu email for enhanced features!
Open QGIS
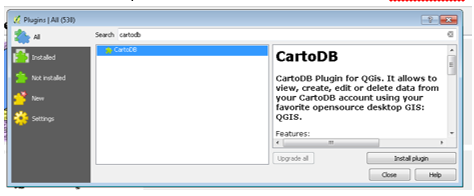
Install the CartoDB plugin
a. In the Plugins menu, click Manage and Install Plugins…
b. Search for “CartoDB”
c. Click Install plugin
d. Once installed, make sure the box next to “CartoDB” is checked in the plugin window

Sign in to the CartoDB plugin
a. You should now have CartoDB buttons in the Web toolbar. Click on Add connection

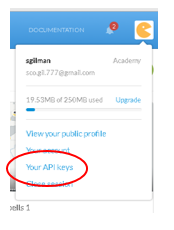
b. You will be prompted for your username and API key. Your API key can be found on CartoDB.com. Once signed in, click on the pacman symbol in the top-right, then click Your API Keys

c. Click OK
d. Click Connect
e. You should see your CartoDB username where “Add connection” used to be
Add necessary layers to the map
a. Connect to the MassGIS WFS
b. Add the layers “Bicycle Trails” and “Town Boundaries” to the map
c. Download “WebGIS_CartoDBex.zip” download link
d. Unzip to your preferred location
e. In QGIS, use the Add Vector button to find the unzipped shapefile and add it to the map

Click the Upload Layers to CartoDB button
- Highlight all of the layers, then click Upload
Create new map in CartoDB
Navigate to your CartoDB dashboard by clicking on the icon in the top-left corner

Click New Map
Select all three datasets you uploaded – “openspace_5coll”, “town_boundaries”, and “bicycle trails”
Click Create Map
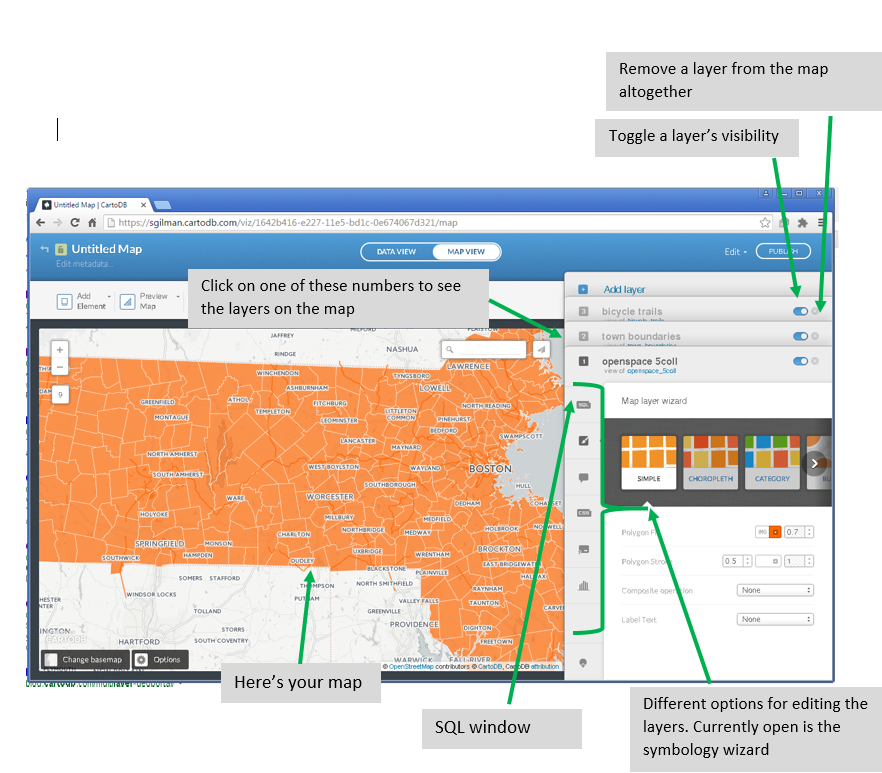
A quick intro to the CartoDB Editor

Create study area from towns layer
Open the SQL window for the “town_boundaries” layer and write a query to select the towns of Easthampton, Northampton, Hadley, and Amherst. Here’s something to help get you started:
SELECT * FROM town_boundaries
WHERE town = ‘EASTHAMPTON’ OR ___________________________________
Fill in the blanks, and you’re all set!
Note: do not copy and paste this expression – the opening/closing quotes aren’t recognized!
Click Apply query In map view, you should see only the four towns in the study area. In data view, you’ll see the four rows corresponding to each town.
Click Create dataset from query above your map.
The default name is “Town_boundaries_copy”. Cilck on the table name in the upper left-hand corner to rename it to “study_area”
Click the back arrow
then the dashboard icon
 to return to your dashboard
Open your map
Use the plus button in the layers sidebar to add the “study_area” to your map
Remove “town_boundaries” from the map – we don’t need it anymore!
Select bicycle trails in our study area
Open the SQL window for “bicycle_trails”
Write the following query to create a new table of bicycle trails that overlap (i.e., intersect) the study region, filling in the blanks where necessary:
SELECT
    bicycle_trails.cartodb_id AS cartodb_id,
    bicycle_trails.the_geom_webmercator AS the_geom_webmercator,
    ___________.trailname
FROM bicycle_trails, study_area
WHERE ST_Intersects(bicycle_trails.the_geom_webmercator, ____________.the_geom_webmercator
If you’re stuck on this last blank, check out the PostGIS documentation for the tool ST_Intersects()
Create a new table (nham_biketrails) from this query and add it to the map
Create a 100m buffer around the bike trails
Open the SQL window for “nham_biketrails”
Write the following query to create a new table of buffered bike trails in our area, filling in the blanks where necessary:
SELECT
      nham_biketrails.cartodb_id AS cartodb_id
        ST_Buffer(__________.the_geom_webmercator, ____) AS the_geom_webmercator,
      __________.trailname
FROM _________
Create a new table (bike_buffer) from this query and add it to the map
Note: check out the PostGIS documentation on the buffer tool if you’re stuck.
Create a table/layer showing where the bike trail buffers and conserved land overlap
Open the SQL window for the bike_buffer
Write the following query to create a new table/layer which shows the overlap between the bike trail buffers and conserved land. In the output table, make sure you include the column “prim_purp” from the table/layer “openspace_5coll” – we’ll use this column in a future query.
SELECT
    ___________.cartodb_id AS cartodb_id,
    ST_Intersection(__________.the_geom_webmercator, __________.the_geom_webmercator) AS the_geom_webmercator,
    ___________.___________
    ___________.___________
FROM
    __________, __________
Note: check out the PostGIS documentation on ST_Intersection() – it is different from ST_Intersects()!
Create a new table (consland_bike) from this query and add it to the map
Find the total area of conserved lands within 100m of bike trails
- Open the SQL window for
- Use the following query to calculate the sum the area of all polygons in the layer you created in the last step
SELECT
    SUM(ST_Area(____________))
FROM consland_bike
Find total area of conserved lands without recreational access within 100m of bike trails
Try doing this one completely on your own! Here’s a hint: It will look a lot like the last query, but you will be incorporating the column “prim_purp” from the table “consland_bike”. Another hint: you should be able to figure out by looking at the GitBook from the first week we used SQL.
Conclusion
At this point, you may be thinking, “Why would I write all of these cumbersome SQL/PostGIS queries when I could do this same thing using the much simpler graphic interfaces of QGIS or ArcGIS?” If Friends of Northampton Trails and Greenways were only interested in answering this one question (What is the total area of conserved lands within 100m of their bike paths?), using QGIS or ArcGIS would be just fine. But, in the future, they might need to find out the total area of conserved lands within 100m of their hiking trails. Or, maybe they’ll add a new bike trail, or the Kestrel land trust will buy more land for conservation, and they’ll need to recalculate the answer to this question. Or, in the open-source spirit, they want to share the ability to answer this question with other trail nonprofits in Massachusetts, the US, or across the world.
In these scenarios, simply clicking through the tools would not be enough – rather, we need a way to automate the process. Automating a process in GIS lets users repeat the same sequence of tools on any data sets they choose without having to redo the process every time. You can automate a process in ArcGIS or QGIS using Model Builder. Using an ArcGIS or QGIS model, however, requires having both the software and a staff member who can use the software. PostGIS gives us a lot more flexibility. You can (and will) use JavaScript to send this type of query to your PostgreSQL database and display the results on a web map such as the one you created in CartoDB for this exercise. Make this process into a JavaScript web mapping application, and suddenly anyone with an Internet browser can perform this analysis with the click of a button.
Answers
A.
Select 4 towns in Massachusetts (Easthampton, Northampton, Hadley, Amherst): this can be done with SQL tools – select these four towns using the column of town names
Select bike trails inside these 4 towns: ST_Intersects()
Create buffer around these trails: ST_Buffer()
Create layer of overlap between buffers and conserved lands: ST_Intersection()
B.
SELECT * FROM town_boundaries
WHERE town = ‘EASTHAMPTON’ OR town = ‘NORTHAMPTON’ OR town = ‘HADLEY’ OR town = ‘AMHERST’
C.
SELECT
          bicycle_trails.cartodb_id AS cartodb_id,
          bicycle_trails.the_geom_webmercator AS the_geom_webmercator,
          bicycle_trails.trailname
FROM bicycle_trails, study_area
WHERE ST_Intersects(bicycle_trails.the_geom_webmercator, study_area.the_geom_webmercator)
D.
SELECT
          nham_biketrails.cartodb_id AS cartodb_id
          ST_Buffer(nham_biketrails.the_geom_webmercator, 100) AS the_geom_webmercator,
          nham_biketrails.trailname
FROM nham_biketrails
E.
SELECT
bike_buffer.cartodb_id AS cartodb_id,
          ST_Intersection(bike_buffer.the_geom_webmercator, openspace_5coll.the_geom_webmercator) AS the_geom_webmercator,
openspace_5coll.name,
openspace_5coll.prim_purp
FROM
          bike_buffer, openspace_5coll
F.
SELECT
          SUM(ST_Area(consland_bike.the_geom_webmercator))
FROM consland_bike
Answer: 1527608.51….. m^2
G.
SELECT
          SUM(ST_Area(consland_bike.the_geom_webmercator)),
          consland_bike.prim_purp,
FROM consland_bike
GROUP BY consland_bike.prim_purp
Answer: 666793.64….….. m^2