4.2. Georeferencing a Scanned Paper Map or Image (such as an aerial photo)
A note before we begin: We are assuming students in this course are already familiar with concepts such as map coordinate systems, datums and projections. If that is an incorrect assumption, we encourage you to read the “Understanding Coordinate Systems and Map Projections” available on the course Moodle site under Week 4 content.
While as we noted in Section 4.1, there are many places on the Internet where you can get already georeferenced digital raster data in a variety of formats, it is sometimes the case where a project needs raster data but the only available data are in paper form, such as a paper map, or is in digital form, such as a .jpg, but that jpg file is not georefrenced. Examples of the former — paper maps — often occur in projects that are historical in nature. Suppose, for example, that your project wants to display interactive layers that represent the change in beach shape or erosion over the last 50 years for some beach area in Cape Cod. There might be available aerial photographs representing different time points over the last 50 years, but they very well could be printed paper photos. An example of a digital jpg file might be current day photos taken by a low-end quadcopter, but the imagery is only a jpg file and not “georeferenced”, meaning that there is no accompanying coordinate system or projection file that helps GIS software place that image in some geographically explicit coordinate space. A jpg image that does not have coordinate or projection information “attached” to it, will simply sit in a GIS mapping software like QGIS somewhere around the 0,0 point of a cartesian plane.
This section describes part of the process for getting a paper map or digital raster image that is not associated with a map coordinate system so that it is georeferenced.
To begin, you must do several things:
First, if you have a paper map that you want to get into GIS, then you must identify the metadata on this map that tells you what coordinate system or map projection it is in. Look for information like “Projection” or “Datum”.
If the “map” you want to work with is an aerial photograph on paper, or a jpg or other scanned raster file of that image, well, that image will likely not have a projection or coordinate system associated with it (unless this is an already georeferenced raster image where it has another file with the same first name but with an extension name like ‘.twf” — standing for “tiff world file” — which IS its georeferencing information. Recall we discussed this in Section 4.1.
4.2.1. Georeferencing Step 1. Review your paper map for needed metadata.
To build on this section’s introduction, let’s first describe a common scenario where you need to do this kind of georeferencing. Imagine you are working in a part of the world that doesn’t have easily available digital raster maps, such as USGS topographic maps. In the United States, scanned, geographic digital rasters of these are sometimes called “Digital Raster Graphics” or DRG files, but in many parts of the world the only map data you have available to you is good old paper hardcopies like the one shown in Figure 4.2.1, below.
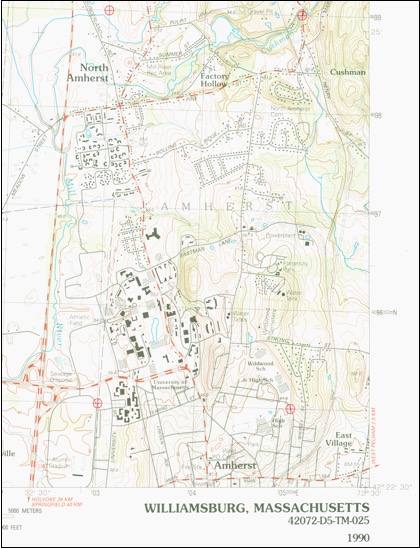
The first step toward the digitizing and georefencing this paper map is to review its metadata — “data about data.” Figure 4.2.2 below is a scan of the metadata that was attached to the paper map shown in Figure 4.2.1.
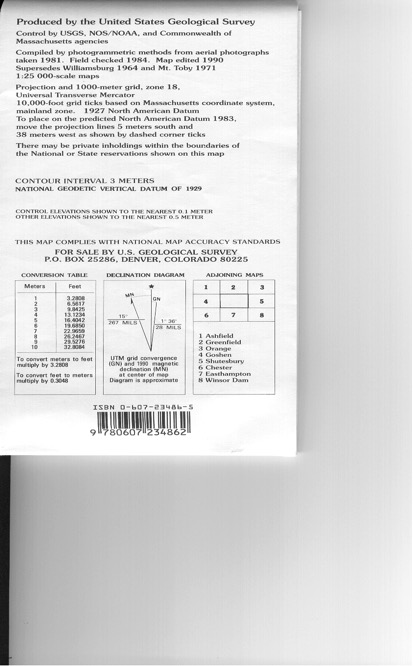
Review this metadata and paper map specifically looking for information on its map coordinate system used (coordinate system and datum) and to see if there are coordinate system lines (either projection lines or latitude/longitude “graticule” lines that cross and could serve as “ground control points” of GCPs. In Figure 4_2_1, identifying GCPs will be easy since we have located four of them for you. But look at this map as if those four aren’t there.
Question 4.2.1: What is the map coordinate system used? What is its “datum”? What measurement unit is used? (The answers are at the end of this section).
4.2.2 Georeferencing Step 2. Scan your map to a jpg or tif file.
In a “real world” situation, next you need to find a digital scanner. Ideally, for maps, this would be a larger scanner device. In desperate situations, you might be able to achieve a usable digital product by, as best you can, flattening your paper map out on a floor or table, and then carefully taking a picture of it using a digital camera or even a smartphone. But those techniques are only to be used in times where no other option is possible. Many copy-shop businesses have large-bed scanners that can do this job for you.
A very important part of this process is to make a note, prior to scanning, of the ground control points (GCPs) you will use to georeference this image. Simply put, GCPs are point locations on the paper map where the coordinates are known. In Figure 4.2.1 above, these are crosshair lines where the UTM projection lines cross. They indicate the geographic location of the center of those crosshairs. So as you make the digital scan, you need to double check the scan output to make sure the GCPs you plan to use to georeference are visible in the scanned output.
The minimum number of GCPs you need to do georeferencing are 4, and they need to be well-distributed across the map, meaning covering the broad “edges” of the map, similar to the four we highlight in Figure 4.2.1 above. Ideally, you would use more than four GCPs and distribute them around the map product. For the georeferencing process, the scanned image gets “stretched” to fit the new coordinate system you specify using the GCP information, which is why you need your GCPs distributed widely on the map product. The more GCPs you have, generally, the more accurate your georeferencing will be, assuming that you place these GCPs accurately in the georeferencing process (described below).
(Side note: If you are in a situation where the paper map or image (such as an aerial photograph) does not have coordinate system crosshair lines of them, a different way to get the GCP information would be to use a tool like Google Earth and zoom in to the area on the earth depicted in your image, to look for (hopefully) permanent objects that have not shifted location, such as road crossings, or where a power line crosses a road, etc. Using Google Earth, you can zoom in to these areas and record the longitude/latitude coordinates of these locations. In this case your paper map’s GCP coordinate system will then be Geographic (Latitude\Longitude) using the global datum WGS84.)
After considering the above, scan your map to a .jpg output. For this exercise, we have done that work for you. Simply right-click on Figure 4.2.1 above and choose “save as” and save the .jpg figure image to an exercise work folder on your computer. Using Windows Explorer or Finder (mac) rename that image and call it “topomap_scan”.
4.2.3. Enable and run the QGIS Georeferencer plug-in.
Start up QGIS.
QGIS has its own georeferencing plugin tool, called the “georeferencer.” To work with it, you have to enable it first. On the menu bar, go to Plug-ins, Manage and Install Plugins, and search for “georeferencer” as shown in Figure 4.2.3.1 below.

Click on the white box to the left of the Gereferencer GDAL to enable it and close the Plugins window. By enabling this plugin, the georeferencer tool now is available under the options under the Raster menu item as shown in Figure 4.2.3.2 below.
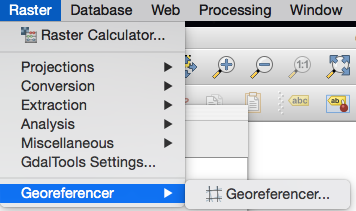
Click on Raster, Georeferencer to invoke this tool. The Georeferencer window should appear.
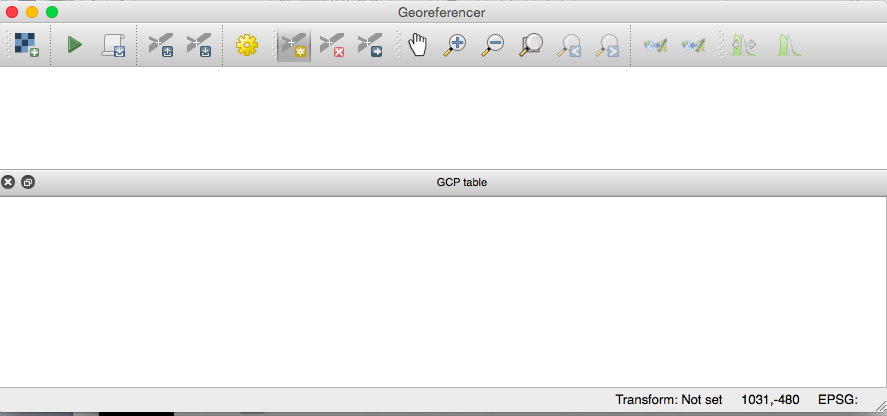
The plug in is divided into two sections. The top half is where the scanned map image will appear. The bottom section will be where we work with GCP information.
First, in the georeferncer, open the “topomap_scan.jpg” you saved earlier by clicking on the “open raster” icon and navigating to the folder where you stored that file.

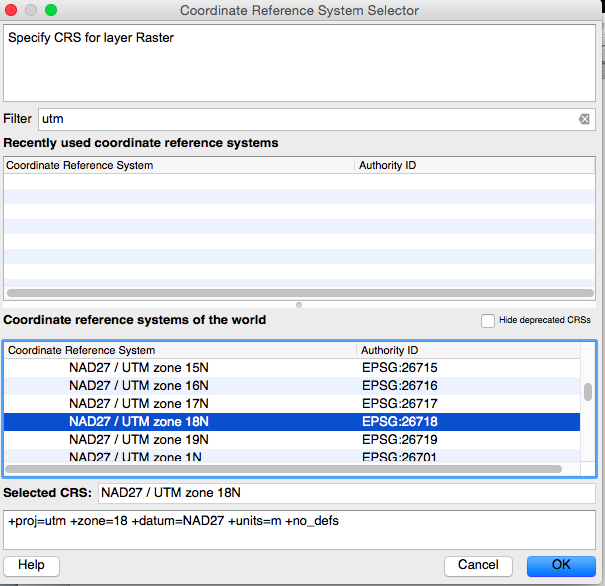
The next window that appears is QGIS’ Coordinate Reference System Selector window (Figure 4.2.3.4 below) where you are being asked to specify the coordinate system for the scanned map you are about to georeference. Recall Question 4.2.1 we asked earlier. What coordinate system and datum does this scanned map use? (See the answer below if you have forgotten). Under the filter you can type in the CRS search term and then look through the list for the one you want. Or, typically you will use some of the same coordinate systems over and over, so you could keep a list of the EPSG numbers that are associated with these coordinate systems. For example, in Massachusetts, we tend to use, often, Massachusetts State Plane, NAD83 or UTM zone 18N NAD27.
But importantly — what you enter here needs to be the map coordinate system that is specified on the map metadata! You cannot just choose the coordinate system you want it to be! The figure below shows the correct selection for this particular map.
Click OK. Your scanned topo map should appear in the top window of the Georeferencer.
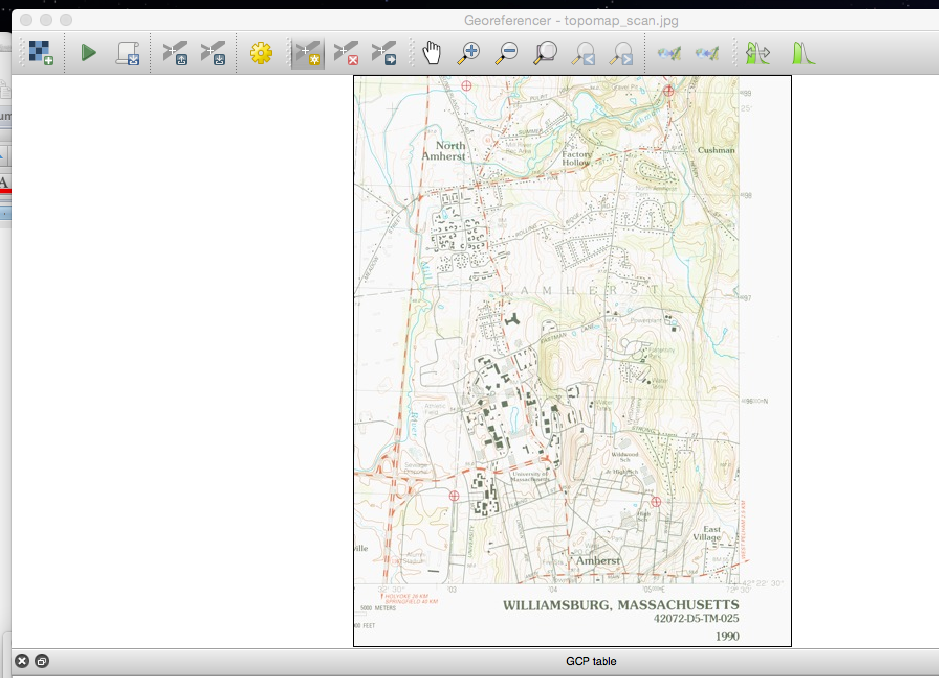
Now we are ready to start entering in our ground control point data to convert the scanned map .jpg from a coordinate system that has a origin centered around the coordinate (0,0) to one that is moved into the map coordinate system (in our case, UTM Zone 18). To see what we mean, in the Georeferencer window, move your cursor to the top left corner of the scanned map. While doing this, look at the X, Y coordinate numbers shown in the bottom right of the screen. If you move the cursor to the top left corner of the map, you should see the following in the bottom right:
Transform: Not Set 0,0 None
The 0,0 (or some small numbers like -2, 3 depending on where your cursor is) shows that currently your .jpg image is being displayed in a simple X, Y cartesian plane with the origin at 0,0 in the top left.
Now what we want to do is systematically, tell the computer point locations on the scanned map (GCPs) and then enter their X, Y values using the map coordinate system. But what numbers do we need?
If you notice on our scanned image, we have drawn four small red crosshairs with a circle around them, designating the four GCPs we want to use for this georeferencing exercise. Each of these four points have associated UTM Zone 18 coordinate numbers associated with them. We show these coordinates using callouts in the Figure below.
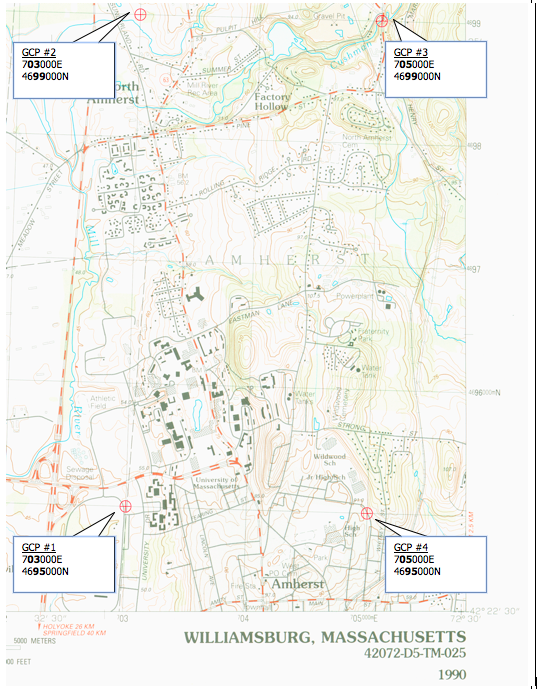
You probably know how we got those coordinates. But in case you don’t, let us describe how, using GCP #4 (bottom right of the above figure) as an example.
In your Georeferencer browser, use the zoom tool (the little magnifier glass with the +) and zoom into the bottom right corner of the map to get a better look at the lines that intersect at GCP #4 in the Figure above. After zooming, your screen should look something like the below:
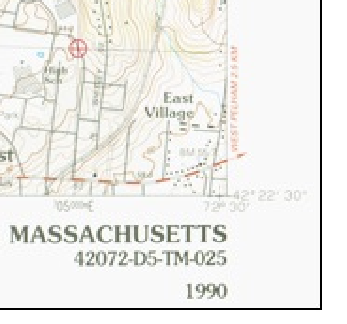
The coordinates at the crosshair of GCP #4, is
705000E 4695000N
The scan in the figure above is is hard to read the UTM “Easting” coordinate numbers at the bottom, but the line that the GCP #4 is on is 705000E and if your eyes are good, you should be able to read that (except for the very small 7 at the beginning of the number). Note that these coordinates are different than the Latitude/Longitude coordinates that are also shown at the bottom right of the figure above. We are going to enter the UTM coordinates, not the Lat/Long coordinates.
The UTM coordinates for the “northing” lines (the ones going up the Y axis) can be seen a little higher up the map on the right boundary, as shown in the figure below.
[Fig_4_2_3_9.png]
It was using those coordinates, that we were able to identify the GCP coordinates for GCP 1,2,3 and 4 in the figure with the callouts shown earlier.
Our task at this juncture is to digitize our selected GCPs and enter their corresponding coordinates so that QGIS can “shift” the map from the cartesian coordinates centered around (0,0) to the map UTM coordinate system that has coordinates roughly around (703000, 4699000).
It is imperative that you enter the GCPs systematically, and you carefully enter the coordinate data. Double or even triple-check your entering in of these coordinates. One typo of a digit will cause big problems!
Our GCP coordinates are as follows:
GCP #1 (bottom left): 703000E, 4695000N GCP #2 (top left): 703000E, 4699000N GCP#3 (top right): 705000E, 4699000N GCP #4 (bottom right): 705000E, 4695000N
To enter the GCPs, there are three icons on the tool bar of the Georeferencer: Add point, Delete point and Move point. The Add point icon has the small yellow star and is the first on the left, the delete point has the red “x” and is the middle, and the move point has the arrow pointing to the right. These icons are shown below.

Using the Zoom and Pan tool, zoom in to the first GCP location in the bottom left. Your zoom should enable you to see the crosshair location clearly so you can digitize that location with minimal spatial error. Zooming in too close will result in a pixelated image making it harder to locate that crosshair. Once you have a zoom that gives you a clear and accurate look at the crosshair, click the “Add point” icon and carefully click on the crosshair location for GCP #1.
The Enter Map Coordinates window appears. Enter GCP #1’s Easting (East) and Northing (North) coordinates. Your screen should look similar to the figure below.
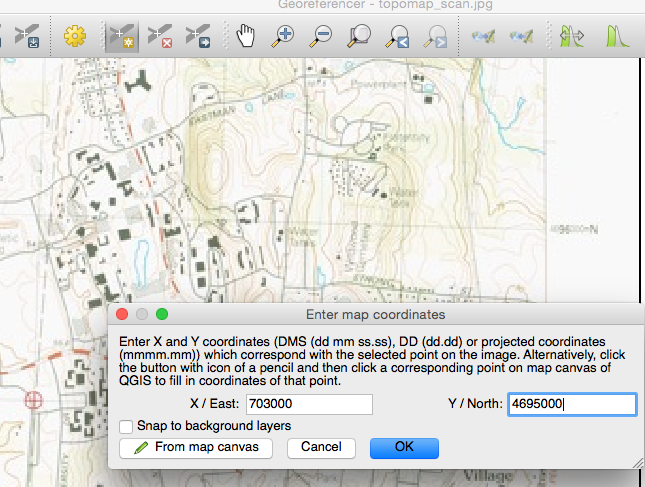
Double check your coordinate typing, and if satisfied, click OK. A red dot will appear where you entered that coordinate and you will see a row appear in the lower part of the Georeferencer window (see the Figure below).
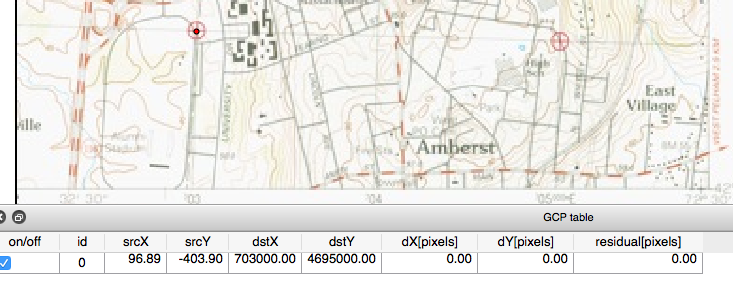
The GCP table is describing the location of the point in terms of the original “source” cartesian coordinates (srcX, srcY) as well as the new “destination” UTM coordinates for the point you just entered (dstX, dstY). Right now, given there is only one GCP entered — remember you need a minimum of 4 — so the moving or “stretching” or the “georeferncing” of the image can’t be completed yet. The residual(pixels) number at the right will give you an indication of the goodness of the fit of your coordinates once you have at least four GCPs recorded. Stay tuned.
Zoom out and move your window to zoom into the second GCP at the top left of the map image. Follow the same procedure as above: Zoom in to the right view for accuracy, click the add point icon, carefully add the GCP coordinate data, after double checking your coordinate input, press OK. After completing, systematically, the four GCPs, your map should have four points digitized and four records in your GCP table. The Georeferencer will use the destination coordinates to “warp” and fit the image to the map coordinate system you have specified.
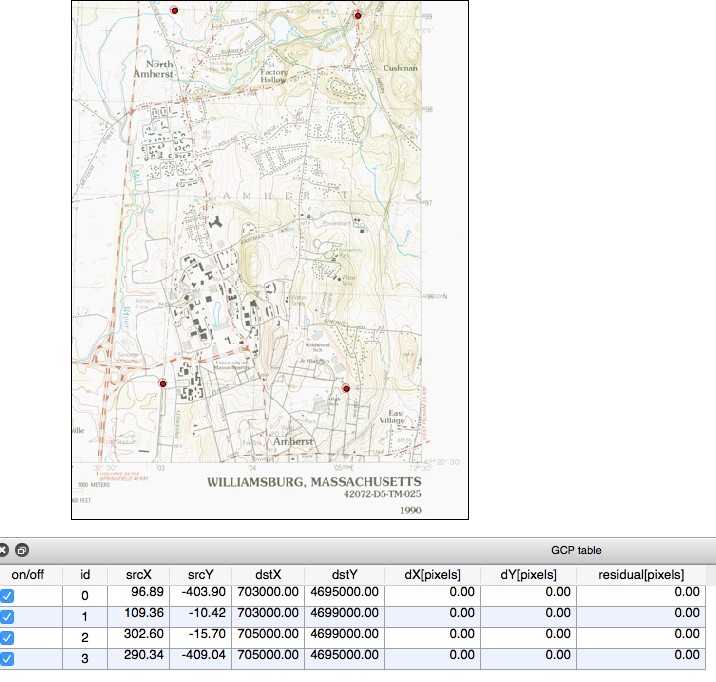
Notice that the coordinates in the bottom right are still in the original cartesian plane system that is has an origin in the top left of (0,0).
Now we are ready to “Transform” the image from the old coordinate system to the new one. Select the “Transformation Settings” icon at the top icon menu  or go to the QGIS menu and choose “Settings”, “Transformation Settings.”
There are a number of different algorithm approaches to transform the image to the map projection coordinate system.
According to the QGIS documentation on the Georeferencer [1] the following transformation types are available:
•    The Linear algorithm is used to create a world file and is different from the other algorithms, as it does not actually transform the raster. This algorithm likely won’t be sufficient if you are dealing with scanned material.

•    The Helmert transformation performs simple scaling and rotation transformations.

•    The Polynomial algorithms 1-3 are among the most widely used algorithms introduced to match source and destination ground control points. The most widely used polynomial algorithm is the second-order polynomial transformation, which allows some curvature. First-order polynomial transformation (affine) preserves colliniarity and allows scaling, translation and rotation only.

•    The Thin Plate Spline (TPS) algorithm is a more modern georeferencing method, which is able to introduce local deformations in the data. This algorithm is useful when very low quality originals are being georeferenced.

•    The Projective transformation is a linear rotation and translation of coordinates.
The one we’ll use in this exercise is the “Polynomial 1” (Polynomial 2 requires at least 6 GCPs which is why we are not using that one).
In the Transformation settings window, Enter the following:
Transformation Type: Polynomial 1 Resampling method: Nearest neighbor Compression: NONE Output raster: topo_utm (and save it to an exercise work folder on your hard disk). It will save it as a “geotif” (.tif) format. Target SRS: NAD27 / UTM Zone 18N (this is the coordinate system you want it translated to. See the figure below.)
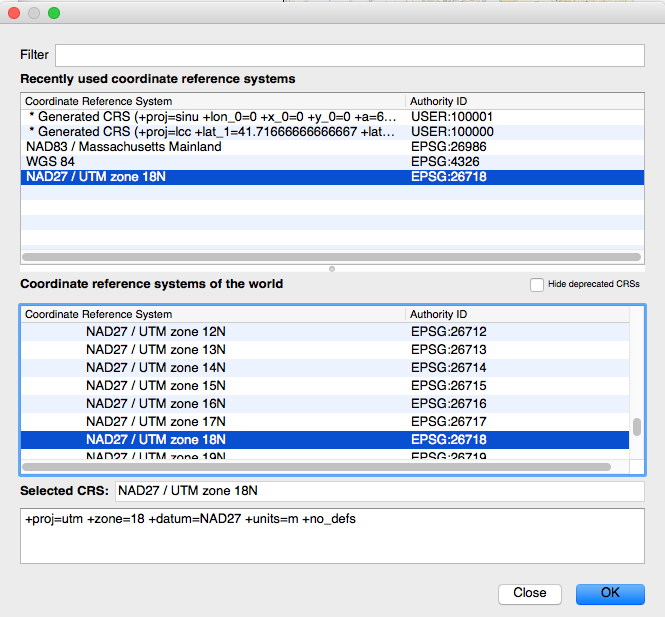
Click OK on the Transformation Settings window.
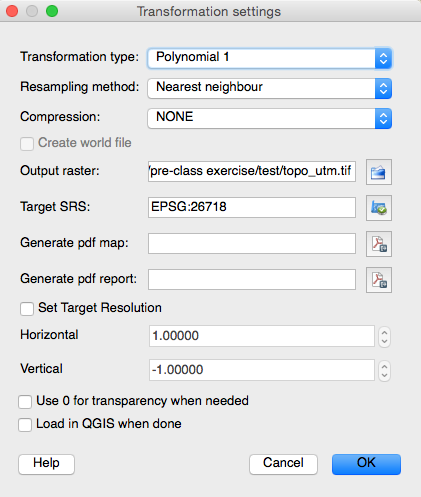
You will now see some new information in the GCP table with residuals.
The dX and dY columns GCP table report the difference in location between the reference image and the rectified image in pixels. The residual column reports the residual value for the control point. Below the GCP table is the transformation (rectification) mean error when we ran this exercise. Note at the bottom right corner you also have a “Transform:… Mean error” score.

Ideally, you will work to achieve a residual value less than 0.5 pixel width or less than some small acceptable tolerance. Additionally, ideally the Transform mean error at the bottom of the window will be less than 2.0. In our case, it is .126015. Not bad.
Generally, ff the residual is less than 0.5 pixels and/or the mean error is less than 2.0, the rectified image is probably pretty good. If the residual is greater than 0.5 pixels or the mean error is greater than 2.0, then delete or readjust the existing GCPsl to reduce the residual error. Try taking more GCPs and see what effect this has on the residuals and the Mean error score. If you need to delete a GCP you digitized poorly, use the delete point tool (next to the add point icon). Or is you need to move one to a better location, use the Move Point tool.
Small changes and not “choosing the exact pixel” between the two images can have dramatic effect on the resulting residuals and hence the quality of the final rectified image output.
Once you are satisfied with the mean error, we can run the Georeferencing process. In the Georeferencer window, press the Start Georeferencing (“play”) icon.

A small window will pop up signaling the processing of the georeferecing process. In our case, it was very fast. The new georeferenced GeoTif file that we named “topo_utm.tif” should be in your work folder on your hard disk.
Close the Georeferencer window. Save the GCP points in case you want to georeference the image again to adjust for overlay errors you witness later when you try and overlay this new .tif file with another spatial data layer.
4.2.4. View the new georeferenced topo_utm.tif in QGIS
Open up a new QGIS map (if it isn’t already open) and look at the current coordinate system. It should be a cartesian plane around 0,0.
Add a new raster layer, and choose your topo_utm.tif file.
You should see the new georeferenced image, with the image slightly skewed to the upper left, which was a result of the transformation process, warping the image to the GCP coordinates that you entered, as shown in the figure below.
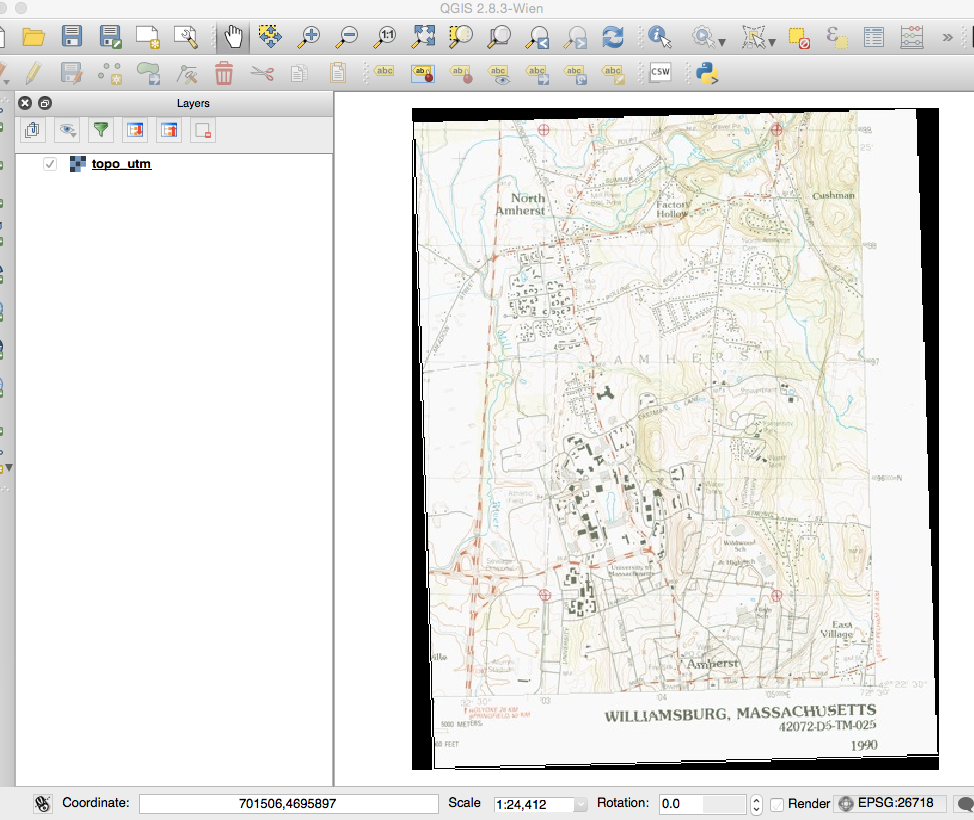
The EPSG at the bottom right should read 26718, which is the number associated with the projection UTM Zone 18N, NAD27. If you move your cursor over the map, you will see the coordinates at the bottom change from simple small numbers to the larger numbers representing the UTM coordinate system.
Finally, you could check the Project menu, Project Properties option, to double-check that this QGIS map project took on the UTM 18 N, NAD27 map projection or coordinate system.
Congrats! You’ve georeferenced a scanned paper map!
4.2.5. Georeferencing other scanned products, such as digital aerial photographs
Sometimes the GIS Analyst needs to georeference paper or digital products that are not map products with no coordinate system lines on it. For example, several times in our career we’ve had to do this to get historical aerial landcover photos into GIS, or perhaps some very old paper maps that did not have coordinate lines on them. An example of the latter was a very old map a student of ours had of the city of Boston during the revolutionary war. All this paper map (taken from some history book) had on it was roads and beach shore locations.
It can be a challenge, but in these kinds of cases you can do the same process as described above. The key issue is finding GCP locations and their coordinates. One way to do this in this “modern Internet era” is to use a tool like Google Earth to find the lat/long coordinates of road intersections that you see on the image you are trying to georeference. For aerial photographs, there might be other objects in the image you could use, like some rock outcroppings that are visible and appear to not have changed in the Google Earth image. We discussed this earlier, but again, road crossings, road and electrical line crossings, larger objects like rock outcroppings are possibly helpful choices for GCPs. Even building corners might work. You just have to find objects that you can see in the image or map you are trying to georeference and what you can see in the Google Earth image.
Systematically find the GCP coordinates by comparing the image with Google Earth and then carefully record the Google Earth Lat/Long location it displays when your cursor is over the desired location.
Another approach would be to use a GIS layer you already have georeferenced, such as a roads layer for the area, and in QGIS use the cursor to find the coordinates for road crossings you see in your, currently, no-georefenced image.
Finally, another rather time-consuming way to get GCPs is to take a GPS and go out to places that are still identifiable in your old image or map. This assumes you are in the geographic vicinity of where you are trying to map.
Once you have collected at least four GCPs for this image, you can go through the same process as described above.
References
[1] https://docs.qgis.org/2.2/en/docs/user_manual/plugins/plugins_georeferencer.html
Answers to questions asked in Section 4.2.
Question 4.2.1. What is the map coordinate system used? What is its datum? What measurement unit is used?
Universal Transverse Mercator (UTM) map projection. Zone 18. Surprisingly, the metadata doesn’t tell us that this is UTM Zone 18 North, but the map makers probably assumed that people would know that this area of the world, Massachusetts, is in the northern hemisphere. 1927 North American Datum (NAD27) Units: meters
If this is confusing to you, that probably means you don’t understand map coordinate systems and projections very well. We encourage you to read the “Understanding Coordinate Systems and Map Projections” pdf reading that is available on the course Moodle site under Week 4 content to brush up on these topics.